
Test 21
3D vegetation cylinder under waves
(R. Almeida Reis, T. Suzuki)
Introduction
The present benchmark test case aims to simulate and validate the interaction of long-crested waves with a vegetation stem, based on flume experiments conducted for 5 m length artificial vegetation fields exposed to regular waves. A detailed description of the experiments can be found in Reis et al. (2024). The test case focuses on the movement of a flexible vegetation stem (an artificial cylinder) among a submerged vegetation field at a density of 440 cylinders per m², conducted under wave test conditions identified as Sr07_T14_H09 in Reis et al. (2024). The benchmark experimental results (Benchmark results) consist of time series data obtained at half the vegetation field length, including free surface elevation, flow velocity, wave force applied to a single cylinder (referred to as the “test target cylinder”), and the swaying motion of the test target cylinder.
Flow phenomena
Wave vegetation interaction with a flexible vegetation stem (artificial flexible cylinder).
Experimental conditions
This section presents relevant experimental conditions of the benchmark test case. Table 1 gives the characteristics of the flexible cylinders, Figure 2 shows the measurement positions of the Benchmark results, and Table 2 summarizes the wave conditions at the Benchmark results location.
Table 1. Characteristics of the flexible cylinders.
Material | Diameter, dv [m] | Length, lv [m] | Mass density, ρv [kg/m³] | Young’s elastic modulus, E# [MPa] | Flexural rigidity, EI [N m²] | Buoyancy, B§ [-] |
Sponge rubber | 0.01 | 0.25 | 290 | 0.82 | 4.0 × 10⁻⁴ | 21 |
# E was determined from tensile stress experimental tests.
§ Following Luhar and Nepf (2011), the buoyancy parameter is given by B = (ρ - ρv) g π dv² lv³ (4 EI)⁻¹, where ρ is the mass density of the water (1000 kg/m³), g is the gravitational acceleration (= 9.81 m/s²), and I is the second moment of area (I = π dv⁴/64, for a filled circle).
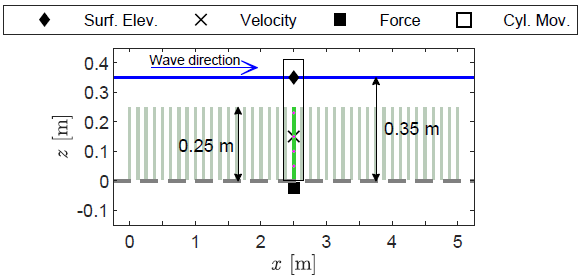
Table 2. Benchmark test case wave conditions.
Still water depth [m] | Wave period [s] | Wave height [m] |
0.35 | 1.4 | 0.076 |
Benchmark results
Benchmark experimental results, obtained under the outlined Experimental conditions, are provided in a single ASCII text data file. This file (Benchmark_Results.dat) contains the synchronized benchmark results with a time step of 0.02 s. Table 3 outlines the structure of the benchmark results data file, mapping its columns to their respective parameters.
Table 3. Structure of the benchmark results data file (Benchmark_Results.dat).
Column 1 | Time [s] |
Column 2 | Free surface elevation [m] |
Column 3 | Horizontal (along x) flow velocity component [m/s] |
Column 4 | Horizontal (along x) force applied on the test target cylinder [N] |
Columns 5-7 | Horizontal (along x) velocity component of the three top magenta marks on the test target cylinder [m/s] * |
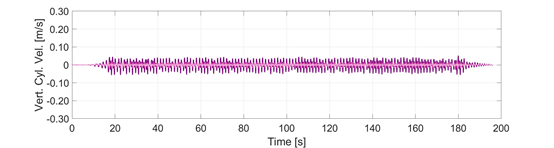
Columns 8-10 | Vertical (along z) velocity component of the three top magenta marks on the test target cylinder [m/s] * |
* Velocity measurements were taken of the three top magenta marks placed at z = 0.92 lv = 23 cm, z = 0.6 lv = 15 cm, and z = 0.4 lv = 10 cm. The movement of the fourth magenta mark (placed at z = 0.2 lv = 5 cm) was minimal, and its velocity was not measured (Reis et al., 2024). The magenta marks on the test target cylinder are illustrated in Figure 2 and can also be seen in Video 1.
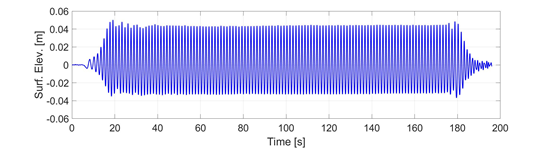
Figures 3-7 present graphs illustrating the benchmark results.


Video 1 presents a cropped sample of the video collected during the experiment, showing the test target cylinder movement.
Simulation
Simulations and validations conducted by researchers should aim to replicate the hydrodynamic conditions observed at the test target cylinder location (namely, the force applied to the test target cylinder driving its motion) during the experiment by considering the outlined Experimental conditions and the Benchmark results provided.
The surrounding cylinders (Figure 2), being part of the system, inevitably have some influence on the test target cylinder. However, it is assumed that the Experimental conditions to be considered in the numerical simulations adequately account for these effects, as the surface elevation was measured at the target cylinder location and, importantly, the horizontal force driving the motion of the target cylinder was directly measured. Furthermore, while the influence of the surrounding cylinders cannot be entirely ruled out, El Rahi et al. (2024) performed simulations excluding them and still reproduced the target cylinder's motion with high fidelity. This suggests that the influence of the surrounding cylinders is minimal.
In the experiments, a piston-type wavemaker was used, generating waves with a sinusoidal signal, preceded by an initial 5-second linear time ramp. The waves travelled approximately 24 m from the generation position until they reached the test target cylinder. Along this route, the waves underwent transformations due to several factors, namely propagation over a 1:20 slope and dissipation along half the length of the vegetation field (Reis et al., 2024). Therefore, in order to simulate the test case, it is proposed to adopt a simplified computational domain, considering the hydrodynamic conditions measured at the test target cylinder position for numerical wave generation. Figure 8 illustrates the computational domain used in El Rahi et al. (2024), showing the submerged test target cylinder in the numerical flume, the wave generation boundary, and the wave damping extent adjacent to the opposite boundary, aiming to fully dissipate the waves while minimizing wave reflections. The detailed description of the numerical approach can be found in El Rahi et al. (2024).

For numerical modelling purposes, researchers may consider the computational domain, while also considering the discretizations (including the initial particle distribution) for testing model convergence, as outlined in Publications using these benchmark results.
Results specification
The results should be delivered in ASCII text file format and/or as comprehensive graphs, enabling direct quantitative comparisons with the Benchmark results, such as error differences, particularly for force and cylinder motion data.
Download
You can download the full test case below:
References
Luhar, M., Nepf, H.M., 2011. Flow-induced reconfiguration of buoyant and flexible aquatic vegetation. Limnol. Oceanogr. 56, 2003–2017. https://doi.org/10.4319/lo.2011.56.6.2003.
Reis, R.A., Fortes, C.J., Rodrigues, J.A., Hu, Z., Suzuki, T., 2024. Experimental study on drag coefficient of flexible vegetation under non-breaking waves. Ocean Eng. 296, 117002, https://doi.org/10.1016/j.oceaneng.2024.117002.
Publications using this test case as a benchmark
El Rahi, J.; Martinez-Estevez, I.; Almeida Reis, R.; Tagliafierro, B.; Dominguez, J.M.; Crespo, A.J.C.; Stratigaki, V.; Suzuki, T.; Troch, P. Exploring Wave–Vegetation Interaction at Stem Scale: Analysis of the Coupled Flow–Structure Interactions Using the SPH-Based DualSPHysics Code and the FEA Module of Chrono. J. Mar. Sci. Eng. 2024, 12, 1120. https://doi.org/10.3390/jmse12071120